subject: To identify which mysql process / setting using high memory usage.
unlike php_memory limit mysql memory allocation is complex things. we need to understand and configure and monitor and configure.
Calculate mysql Total Allocated memory OOM Killer
Buffers:
Innodb buffer pool size ; ex: 512MB (ignoring MYISAM Key Buffer size MYISAM not using)
mysql cache: query removed in mysql 5.7
Per connection Based:
systl open file limit >> mysql open file limit >> mysql open table cache. >>Mysql buffer pool
Table cache
Temporary tables in RAM
Thread cache
show engine innodb status and check the buffer pool section, memory allocated for buffer_pool and related caches
- Active: The memory that’s actively being consumed by database processes or threads.
- Buffer: A buffer is a temporary space in memory that’s used to hold a block of data.
- Free Memory: The memory that’s available for use.
- Cache: Caching is a technique where data is temporarily stored in memory, enabling fast retrieval of data.
buffers and caches are allocated to improve database operations.
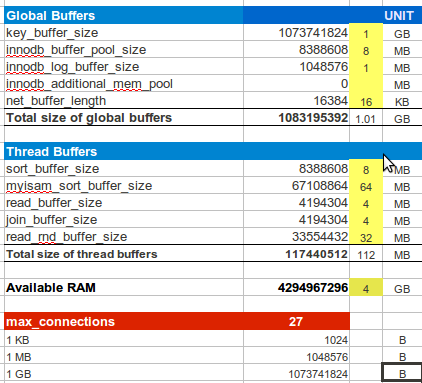
Maximum MySQL Memory Usage = innodb_buffer_pool_size + key_buffer_size + ((read_buffer_size + read_rnd_buffer_size + sort_buffer_size + join_buffer_size) *(X) max_connections)
mysql high memory usage things to check
Every connection = Apporx 100MB memory, >> check active connections(hint CPU usage also raise)
Query cache: disbaled from mysql 8 no worries.
Innodb Memory: it doesn’t go above limit specified
key_buffer_size: if you are not using MYISAM as storage engineer ignore it.
mysql open limit files: default 1000 but my case 30000 similar to linux inode limit
mysql open table cache: how many tables in memory
mysql temporary tables memory limit: max_heap_table_size
mysql is multi threaded so htop command shows same percentage for all all child processes or threads.
Identify: problems with mysqltuner
mysql table cache >> look at this 1st:
| Parameter | mysql 8 defaulyt | min -max value | MySQL Default SIZE MB |
|---|---|---|---|
| key_buffer_size (myisam) | 8388608
8MB |
0-25% ram if use myisam engine | |
| + query_cache_size | disabled | ||
| + tmp_table_size | 16777216 16MB |
||
| + innodb_buffer_pool_size | 128MB | ||
| + innodb_additional_mem_pool_size | 8388608
8MB |
||
| + innodb_log_buffer_size | 16M | ||
| + max_connections | 151 | ||
| × | |||
| sort_buffer_size | 0 |
0-256 | |
| + read_buffer_size | 131072
0.13MB |
Minimum Value 8192 Maximum Value 2147479552 |
|
| + read_rnd_buffer_size | 262144
0.26MB 0r 256KB |
Minimum Value 1 Maximum Value 2147483647 |
|
| + join_buffer_size | 262144 | 128bytes -18446744073709551488 | |
| + thread_stack | 286720 | max 16777216TB | |
| + binlog_cache_size | 32768 bytes | ||
-
Global Buffer:
key_buffer_size innodb_buffer_pool_size innodb_log_buffer_size innodb_additional_mem_pool_size net_buffer_size -
Thread Buffer:
sort_buffer_size
myisam_sort_buffer_size
read_buffer_size
join_buffer_size
read_rnd_buffer_size
thread_stack
mysql tuner suggests global buffers+ 64MB for thread memory *max connection = max possible memory usage
mysql> SHOW VARIABLES LIKE '%buffer%';
+-------------------------------------+----------------+
| Variable_name                       | Value          |
+-------------------------------------+----------------+
| bulk_insert_buffer_size             | 8388608        |
| innodb_buffer_pool_chunk_size       | 55574528       |
| innodb_buffer_pool_dump_at_shutdown | ON             |
| innodb_buffer_pool_dump_now         | OFF            |
| innodb_buffer_pool_dump_pct         | 25             |
| innodb_buffer_pool_filename         | ib_buffer_pool |
| innodb_buffer_pool_in_core_file     | ON             |
| innodb_buffer_pool_instances        | 1              |
| innodb_buffer_pool_load_abort       | OFF            |
| innodb_buffer_pool_load_at_startup  | ON             |
| innodb_buffer_pool_load_now         | OFF            |
| innodb_buffer_pool_size             | 55574528       |
| innodb_change_buffer_max_size       | 25             |
| innodb_change_buffering             | all            |
| innodb_log_buffer_size              | 16777216       |
| innodb_sort_buffer_size             | 1048576        |
| join_buffer_size                    | 262144         |
| key_buffer_size                     | 8388608        |
| myisam_sort_buffer_size             | 8388608        |
| net_buffer_length                   | 16384          |
| preload_buffer_size                 | 32768          |
| read_buffer_size                    | 131072         |
| read_rnd_buffer_size                | 262144         |
| sort_buffer_size                    | 262144         |
| sql_buffer_result                   | OFF            |
+-------------------------------------+----------------+
25 rows in set (0.02 sec)
I
mysql> SHOW VARIABLES LIKE ‘%buffer%’;
+————————————-+—————-+
| Variable_name | Value |
+————————————-+—————-+
| bulk_insert_buffer_size | 8388608 |
| innodb_buffer_pool_chunk_size | 134217728 |
| innodb_buffer_pool_dump_at_shutdown | ON |
| innodb_buffer_pool_dump_now | OFF |
| innodb_buffer_pool_dump_pct | 25 |
| innodb_buffer_pool_filename | ib_buffer_pool |
| innodb_buffer_pool_in_core_file | ON |
| innodb_buffer_pool_instances | 1 |
| innodb_buffer_pool_load_abort | OFF |
| innodb_buffer_pool_load_at_startup | ON |
| innodb_buffer_pool_load_now | OFF |
| innodb_buffer_pool_size | 134217728 |
| innodb_change_buffer_max_size | 25 |
| innodb_change_buffering | all |
| innodb_log_buffer_size | 16777216 |
| innodb_sort_buffer_size | 1048576 |
| join_buffer_size | 262144 |
| key_buffer_size | 8388608 |
| myisam_sort_buffer_size | 8388608 |
| net_buffer_length | 16384 |
| preload_buffer_size | 32768 |
| read_buffer_size | 131072 |
| read_rnd_buffer_size | 262144 |
| select_into_buffer_size | 131072 |
| sort_buffer_size | 262144 |
| sql_buffer_result | OFF |
+————————————-+—————-+
26 rows in set (0.01 sec)
default values in mysql 8
mysql global buffers + thread buffers(connection level)
key_buffer myisam
not more than 25% ram when using myisam engine.
thread_cache_size
new connection being made needs a new thread created for it. When the connections disengage the thread is destroyed.
majority of connections can be made on cached threads.
default value:
Default Value -1 (signifies autosizing; do not assign this literal value)
Minimum Value 0
Maximum Value 16384
By examining the difference between the Connections and Threads_created status variables, you can see how efficient the thread cache is
SET GLOBAL innodb_buffer_pool_size=1;
mysql> SET GLOBAL innodb_buffer_pool_size=1;
Query OK, 0 rows affected, 2 warnings (0.00 sec)
SHOW VARIABLES LIKE ‘%cache%’;
mysql> SHOW VARIABLES LIKE ‘%cache%’;
+———————————+———————-+
| Variable_name | Value |
+———————————+———————-+
| binlog_cache_size | 32768 |
| binlog_stmt_cache_size | 32768 |
| have_query_cache | NO |
| host_cache_size | 279 |
| innodb_disable_sort_file_cache | OFF |
| innodb_ft_cache_size | 8000000 |
| innodb_ft_result_cache_limit | 2000000000 |
| innodb_ft_total_cache_size | 640000000 |
| key_cache_age_threshold | 300 |
| key_cache_block_size | 1024 |
| key_cache_division_limit | 100 |
| max_binlog_cache_size | 18446744073709547520 |
| max_binlog_stmt_cache_size | 18446744073709547520 |
| schema_definition_cache | 256 |
| stored_program_cache | 256 |
| stored_program_definition_cache | 256 |
| table_definition_cache | 609 |
| table_open_cache | 419 |
| table_open_cache_instances | 16 |
| tablespace_definition_cache | 256 |
| thread_cache_size | 9 |
+———————————+———————-+
21 rows in set (0.01 sec)
mysql max_connections memory usage
128 concurrent connections
table_cache
You might start with a value 2x of max_connections or 2x the total number of tables and then tune from there.
tables opened from disk cached in memory
mysql file descriptor limit should greater than tables limit.
Monitoring MySQL Memory Usage
mysql> SELECT * FROM performance_schema.setup_instruments WHERE NAME LIKE ‘%memory%’;
retuns 400+ rows
SELECT * FROM performance_schema.setup_instruments
WHERE NAME LIKE ‘%memory/innodb%’;
reruned 200+ rows
Temporary tables in RAM (find all in-memory tables by running: select * from information_schema.tables where engine=’MEMORY’ )
*** MySQL’s maximum memory usage is dangerously high ***
innodb_buffer_pool_size (>= 624.2M) if possible.
innodb_log_file_size should be (=16M) if possible, so InnoDB total log files size equals to 25% of buffer pool size.
check exsting innodb log file size and adjust accordingly.
SHOW VARIABLES LIKE ‘innodb_buffer_pool_size’;
+————————-+———–+
| Variable_name | Value |
+————————-+———–+
| innodb_buffer_pool_size | 134217728 | 128MB
+————————-+———–+
1 row in set (0.01 sec)
my.cnf sample configuration
query_cache_limit=8M

query_cache_size=48M

query_cache_type=1

max_user_connections=200

max_connections=32

interactive_timeout=60

wait_timeout=60

connect_timeout=50

thread_cache_size=4

key_buffer= 96M

join_buffer=1M

max_connect_errors=20

max_allowed_packet=32M

table_cache=1024

record_buffer=1M

sort_buffer_size=6M

read_buffer_size=6M

read_rnd_buffer_size=6M

thread_concurrency=4

myisam_sort_buffer_size=32M

server-id=1

user=mysql

tmp_table_size=64M

max_heap_table_size=48M
finding mysql oom killer reasons
how to check mysql memory usage in linux
1st check mysql buffer size usage: my toall allocated mysql memory 25% 1gb ram, and 20+ php fpm pools.
reason: oom killer frequently seen in syslog
mysql> SHOW GLOBAL STATUS LIKE ‘Innodb_buffer_pool_pages%’;
+———————————-+——-+
| Variable_name | Value |
+———————————-+——-+
| Innodb_buffer_pool_pages_data | 15129 |
| Innodb_buffer_pool_pages_dirty | 4 |
| Innodb_buffer_pool_pages_flushed | 89128 |
| Innodb_buffer_pool_pages_free | 1017 |
| Innodb_buffer_pool_pages_misc | 238 |
| Innodb_buffer_pool_pages_total | 16384
mysql> SHOW GLOBAL VARIABLES LIKE ‘%memory%’;
mysql> SHOW GLOBAL VARIABLES LIKE ‘%memory%’;
+—————————————+———————-+
| Variable_name | Value |
+—————————————+———————-+
| connection_memory_chunk_size | 8912 |
| connection_memory_limit | 18446744073709551615 |
| global_connection_memory_limit | 18446744073709551615 |
| global_connection_memory_tracking | OFF |
| locked_in_memory | OFF |
| performance_schema_max_memory_classes | 450 |
+—————————————+———————-+
6 rows in set (0.01 sec)
SHOW GLOBAL STATUS LIKE ‘%conn%’;
mysql> SHOW GLOBAL STATUS LIKE ‘%conn%’;
+——————————————————-+———————+
| Variable_name | Value |
+——————————————————-+———————+
| Aborted_connects | 1 |
| Connection_errors_accept | 0 |
| Connection_errors_internal | 0 |
| Connection_errors_max_connections | 0 |
| Connection_errors_peer_address | 0 |
| Connection_errors_select | 0 |
| Connection_errors_tcpwrap | 0 |
| Connections | 13061 |
| Global_connection_memory | 0 |
| Locked_connects | 0 |
| Max_used_connections | 23 |
| Max_used_connections_time | 2023-07-26 05:25:15 |
| Mysqlx_connection_accept_errors | 0 |
| Mysqlx_connection_errors | 0 |
| Mysqlx_connections_accepted | 0 |
| Mysqlx_connections_closed | 0 |
| Mysqlx_connections_rejected | 0 |
| Performance_schema_session_connect_attrs_longest_seen | 117 |
| Performance_schema_session_connect_attrs_lost | 0 |
| Ssl_client_connects | 0 |
| Ssl_connect_renegotiates | 0 |
| Ssl_finished_connects | 0 |
| Threads_connected | 1 |
+——————————————————-+———————+
23 rows in set (0.00 sec)
| Max_used_connections | 23 |
per connection 100MB 23*100 =2300MB we allocated 1oooMB so there is out of memory oom killer invoked.
Mysql memory usage in linux by htop command
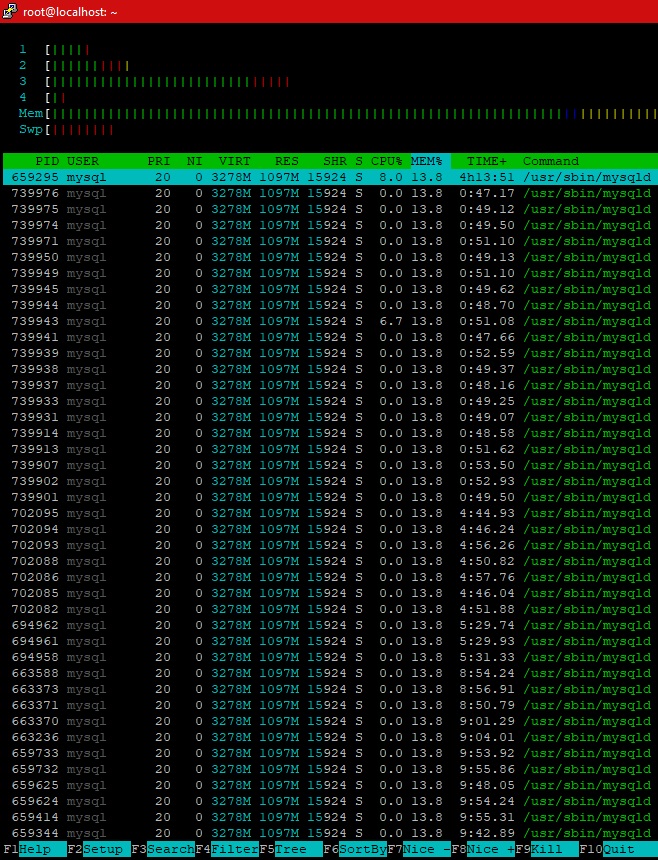
3278M = 3.3GB Memory consuming now as per Htop.
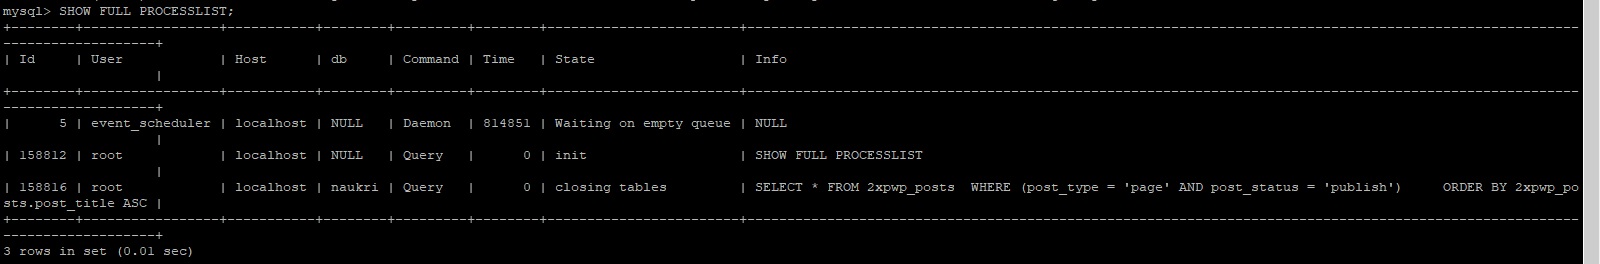
To view all active connections and queries in your database, use the SHOW FULL PROCESSLIST command.
To view long-running transactions, memory utilization statistics, and locks, use the SHOW ENGINE INNODB STATUS command.
watch mysql process list
SHOW FULL PROCESSLIST;
Mysql and php fpm connection timeout
mysql connection: 3600 seconds or 1 hour.
max_execution_time 300s or 5 mins
Only 1 process running.
To check Active mysql active connections
run mysql connection commands to know current connections
show global status like ‘%conn%’;
Variable_name | Value |
+——————————————————-+———————+
| Aborted_connects | 1 |
| Connection_errors_accept | 0 |
| Connection_errors_internal | 0 |
| Connection_errors_max_connections | 0 |
| Connection_errors_peer_address | 0 |
| Connection_errors_select | 0 |
| Connection_errors_tcpwrap | 0 |
| Connections | 158913 |
| Locked_connects | 0 |
| Max_used_connections | 43 |
| Max_used_connections_time | 2021-08-06 15:31:22 |
| Mysqlx_connection_accept_errors | 0 |
| Mysqlx_connection_errors | 5 |
| Mysqlx_connections_accepted | 13 |
| Mysqlx_connections_closed | 13 |
| Mysqlx_connections_rejected | 0 |
| Performance_schema_session_connect_attrs_longest_seen | 116 |
| Performance_schema_session_connect_attrs_lost | 0 |
| Ssl_client_connects | 0 |
| Ssl_connect_renegotiates | 0 |
| Ssl_finished_connects | 0 |
| Threads_connected | 1 |
+——————————————————-+———————+
22 rows in set (0.03 sec)
innodb_buffer_pool_size
512MB
mysql> SHOW VARIABLES LIKE ‘innodb_buffer_pool_size’;
+————————-+———–+
| Variable_name | Value |
+————————-+———–+
| innodb_buffer_pool_size | 536870912 |
+————————-+———–+
SHOW VARIABLES LIKE ‘key_buffer_size’;
mysql> SHOW VARIABLES LIKE ‘key_buffer_size’;
+—————–+———+
| Variable_name | Value |
+—————–+———+
| key_buffer_size | 8388608 | 8MB
+—————–+———+
1 row in set (0.00 sec)
SHOW VARIABLES LIKE ‘max_allowed_packet’;
+——————–+———-+
| Variable_name | Value |
+——————–+———-+
| max_allowed_packet | 67108864 | 64mb
+——————–+———-+
tmp_table_size
SHOW VARIABLES LIKE ‘tmp_table_size’;
mysql> SHOW VARIABLES LIKE ‘tmp_table_size’;
+—————-+———–+
| Variable_name | Value |
+—————-+———–+
| tmp_table_size | 134217728 | 134MB
+—————-+———–+
1 row in set (0.00 sec)
Problem identified: open table cache
Find current value of open_tables and opened_tables
mysql> show global status like ‘open%’;
Find out Table cache hit rate
Table cache hit rate = table_open_cache*100/Opened_tables
Calculate the tune value of table_open_cache and set it
Table_open_cache = total_tables*Threads_connected
Table_open_cache = total_tables*Threads_connected*.50
Along with table_open_cache you should also tune open_files_limit system variable.
In general it is 2x of table_open_cache.
open_files_limit= Table_open_cache*2
Mysql table cache 1101 total tables in mysql. and allocated table cache and file descriptor limits to 30000
has to check out mysql open file limit file descripot increase
suggestion by mysql tuner.
open table cache: 2x of max_connections or 2x the total number of tables
mysql> SHOW VARIABLES LIKE ‘max_connections’;
+—————–+——-+
| Variable_name | Value |
+—————–+——-+
| max_connections | 151 | //default (100mb memory for each connection general maintained mysql)
table_open_cache | 10000
151*2=302
+—————–+——-+
1 row in set (0.00 sec)
mysql> show global variables like ‘%open%’;
+—————————-+——–+
| Variable_name | Value |
+—————————-+——–+
| have_openssl | YES |
| innodb_open_files | 58000 |
| mysqlx_port_open_timeout | 0 |
| open_files_limit | 300000 |
| table_open_cache | 58000 |
| table_open_cache_instances | 16 |
+—————————-+——–+
6 rows in set (0.01 sec)
mysql> show global status like ‘opened_tables’;
+—————+——-+
| Variable_name | Value |
+—————+——-+
| Opened_tables | 7095 |
+—————+——-+
1 row in set (0.01 sec)
mysql> show global status like ‘open_tables’;
+—————+——-+
| Variable_name | Value |
+—————+——-+
| Open_tables | 6693 |
+—————+——-+
1 row in set (0.00 sec)
mysql> SHOW VARIABLES LIKE ‘table_open_cache’;
+——————+——-+
| Variable_name | Value |
+——————+——-+
| table_open_cache | 10000 |
+——————+——-+
1 row in set (0.00 sec)
mysql open tables vs opened_tables table_open_cache
number of opened tables is increasing rapidly, you should look at increasing the table_open_cache value
mysql> show global status like ‘%open%’;
+—————————-+———-+
| Variable_name | Value |
+—————————-+———-+
| Com_ha_open | 0 |
| Com_show_open_tables | 0 |
| Innodb_num_open_files | 456 |
| Mysqlx_cursor_open | 0 |
| Mysqlx_expect_open | 0 |
| Open_files | 370 |
| Open_streams | 0 |
| Open_table_definitions | 639 |
| Open_tables | 6909 |
| Opened_files | 370 |
| Opened_table_definitions | 709 |
| Opened_tables | 7077 |
| Slave_open_temp_tables | 0 |
| Table_open_cache_hits | 13056111 |
| Table_open_cache_misses | 7077 |
| Table_open_cache_overflows | 0 |
+—————————-+———-+
16 rows in set (0.00 sec)
The table_open_cache and max_connections system variables affect the maximum number of files the server keeps open
table cache hit rate: 7% (274 open / 3K opened) since the server start,
opned_tables = from disk
open tables = from memory.
a restart required to effect he stats.
Open_tables | 6694 |
| Opened_files | 243
max_allowed_packet
Total (per session)
innodb_buffer_pool_size
key_buffer_size
Total Memory Needed (for X connection)
Table_open cache vs Table definition cache
number of tables in memory =table_open cache
umber of table definitions (SHOW CREATE TABLE \G) that can be stored. This is to speed up opening of tables and only one entry per table. You should consider increasing this parameter if you have large number of tables (>400) in your DB instance.
Values between 400 and 2000 are good for table_definition_cache.
| variable | table_definition_cache |
|---|---|
| Type | Integer |
| Default Value | -1 (signifies autosizing; do not assign this literal value) |
| Minimum Value | 400 |
| Maximum Value | 524288 |
MIN(400 + table_open_cache / 2, 2000)
SET GLOBAL innodb_buffer_pool_size=-1;
| variable | table_open_cache |
|---|---|
| Type | Integer |
| Default Value | 4000 |
| Minimum Value | 1 |
| Maximum Value | 524288 |
MAX( (open_files_limit – 10 – max_connections) / 2, 400 )
SET GLOBAL table_open_cache=1; (not recommended for debug purpose only)
// memory redueced from 700mb to 350MB in test server 2gb ram 1 core machine.
To know the current running threads
mysql> SHOW PROCESSLIST;
+——-+—————–+———–+——+———+——–+————— ———+——————+
| Id | User | Host | db | Command | Time | State | Info |
+——-+—————–+———–+——+———+——–+————— ———+——————+
| 5 | event_scheduler | localhost | NULL | Daemon | 145300 | Waiting on emp ty queue | NULL |
| 73165 | root | localhost | NULL | Query | 0 | init | SHOW PROCESSLIST |
+——-+—————–+———–+——+———+——–+————— ———+——————+
2 rows in set (0.00 sec)
show global status like ‘%thread%’;
mysql> show global status like ‘%thread%’;
+——————————————+——-+
| Variable_name | Value |
+——————————————+——-+
| Delayed_insert_threads | 0 |
| Mysqlx_worker_threads | 2 |
| Mysqlx_worker_threads_active | 0 |
| Performance_schema_thread_classes_lost | 0 |
| Performance_schema_thread_instances_lost | 0 |
| Slow_launch_threads | 0 |
| Threads_cached | 49 | //mysql thread cache
| Threads_connected | 1 |
| Threads_created | 84 |
| Threads_running | 2 |
+——————————————+——-+
10 rows in set (0.03 sec)
show variable like ‘%thread%’;
SHOW GLOBAL VARIABLES LIKE ‘%thread%’;
SHOW GLOBAL VARIABLES LIKE ‘%thread_cache_size%’;
mysql> SHOW STATUS \G;
displays the name and values of variables that gives you information about the server status
Identify: problems with mysqltuner
-
./mysqltuner.pl
*** MySQL’s maximum memory usage is dangerously high ***
*** Add RAM before increasing MySQL buffer variables ***
key_buffer_size=0
innodb_buffer_pool_size (>= 803.1M) if possible. (512mb)
innodb_log_file_size should be (=64M) if possible, so InnoDB total log files size equals to 25% of buffer pool size.
key_buffer_size=0 (not using myisam as storage engine.)
16M is probably sufficient for any situation.
Buffer Key MyISAM set to 0, no MyISAM table detected
mysql> SHOW VARIABLES LIKE ‘innodb_buffer_pool_size’;
+————————-+———–+
| Variable_name | Value |
+————————-+———–+
| innodb_buffer_pool_size | 536870912 | (512mb)
mysql> SHOW VARIABLES LIKE ‘innodb_log_file_size’;
+———————-+———–+
| Variable_name | Value |
+———————-+———–+
| innodb_log_file_size | 134217728 | 128mb
+———————-+———–+
1 row in set (0.00 sec)
more at mysql bufferpool size
table_definition_cache(900) > 1100 or -1 (autosizing if supported)
table_definition_cache
| Default Value | -1 (signifies autosizing; do not assign this literal value) |
|---|---|
| Minimum Value | 400 |
| Maximum Value | 524288 |
SHOW VARIABLES LIKE ‘table_definition_cache’;
mysql> SHOW VARIABLES LIKE ‘table_definition_cache’;
+————————+——-+
| Variable_name | Value |
+————————+——-+
| table_definition_cache | 900 |
+————————+——-+
1 row in set (0.00 sec)
table_definition_cache setting acts as a soft limit for the number of table instances in the InnoDB data dictionary cache and the number file-per-table tablespaces that can be open at one time.
[–] Physical Memory : 1.9G
[–] Max MySQL memory : 9.8G
[–] Other process memory: 0B
[–] Total buffers: 184.0M global + 65.1M per thread (151 max threads)
[–] P_S Max memory usage: 72B
[–] Galera GCache Max memory usage: 0B
[OK] Maximum reached memory usage: 444.6M (22.42% of installed RAM)
[!!] Maximum possible memory usage: 9.8G (505.29% of installed RAM)
[!!] Overall possible memory usage with other process exceeded memory
[OK] Slow queries: 0% (0/14K)
[OK] Highest usage of available connections: 2% (4/151)
[OK] Aborted connections: 0.53% (1/190)
[–] Query cache have been removed in MySQL 8
[OK] Sorts requiring temporary tables: 0% (1 temp sorts / 2K sorts)
[OK] No joins without indexes
[OK] Temporary tables created on disk: 0% (0 on disk / 379 total)
[OK] Thread cache hit rate: 97% (4 created / 190 connections)
[OK] Table cache hit rate: 65% (16K hits / 25K requests)
[!!] table_definition_cache(450) is lower than number of tables(1132)
[OK] Open file limit used: 0% (9/30K)
[OK] Table locks acquired immediately: 99% (1K immediate / 1K locks)
[OK] Binlog cache memory access: 99.78% (453 Memory / 454 Total)
lemp stack memory allocation for mysql
lamp stack memory allocation for mysql
Other resources
https://aws.amazon.com/premiumsupport/knowledge-center/low-freeable-memory-rds-mysql-mariadb/
http://mysql.rjweb.org/doc.php/memory